Feature Set
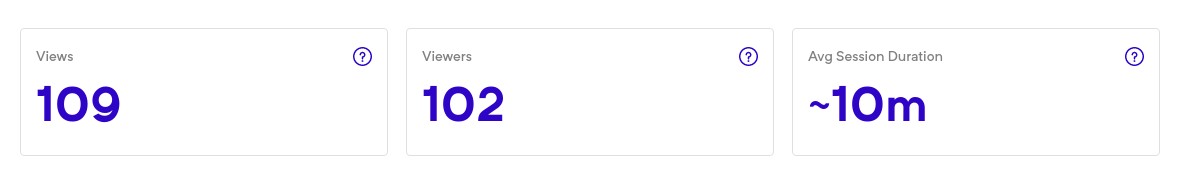
Viewers
This is a count of unique logins that occurred to view your experience.
NOTE
For public deployments, every experience load counts as a new viewer.
Views
This is a count of the number of times your experience was loaded. The views section will also show you a time vs views count graph.
TIER LIMITS
Free accounts support only 50,000 lifetime views acorss experiences.
Want more? Upgrade!
Average Session Duration
This measure gives you an idea of how long a user session lasts on an average.
Average user session duration is the sum of the duration of all user sessions divided by total number of user sessions.
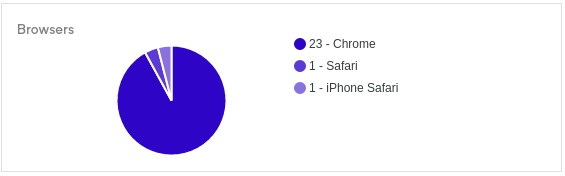
Browsers
This gives you the count of views per browser for your experience. The browser section will also show you a pie chart made with view count per browser.
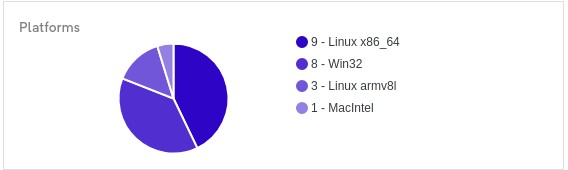
Platforms
This gives you the count of views per platform for your experience. The platform section will also show you a pie chart made with view count per platform.
Viewer Information
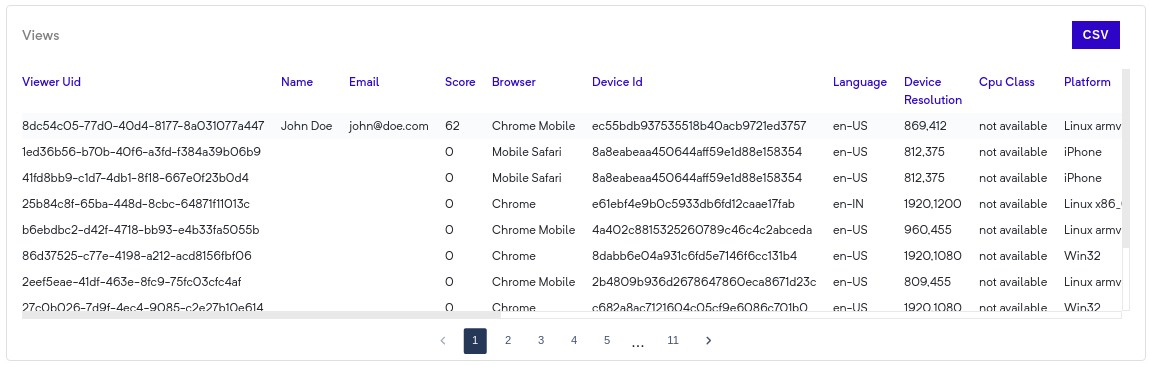
This section shows all information related to every viewer that viewed your experience. This contains information on:
- Viewer Unique Identifier
- Name (blank for public views)
- Email (blank for public views)
- Score (If Score element is present in the experience)
- Browser
- Deice Identifier
- Language
- Device Resolution
- CPU Class
- Platform
- Webgl vendor
- Latitude, Longitude
- Locality
- Admin Area Level 1
- Admin Area level 2
- Country
- Postal Code
- Start Timestamp
- End Timestamp
Sessions by Location
This section shows you geo-location information of your viewers on Google Maps.
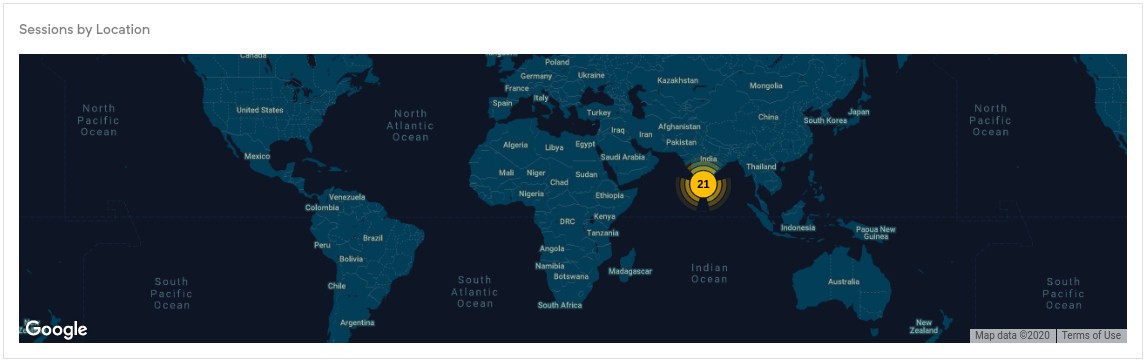
TIER LIMITS
Free accounts do not support this feature.
Want this feature? Upgrade!
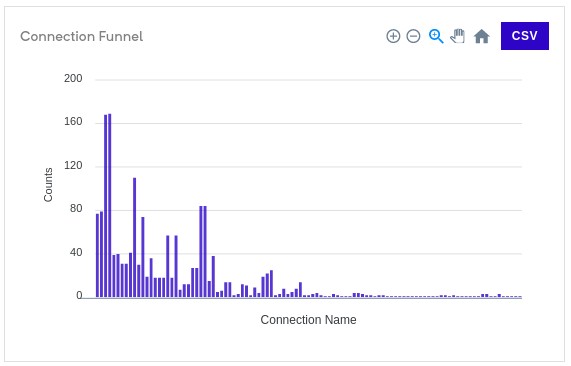
Rule Funnel
This section shows you a frequency chart of how many times a rule in your experience was clicked. Using this information you can gain insights into how your viewers navigate through your experience.
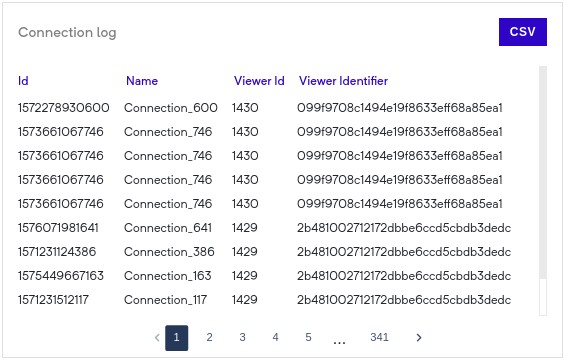
Rule log
This section shows information on the rule and viewers that triggered it. This gives you a fine grained log of how exactly a viewer interacted with your experience.
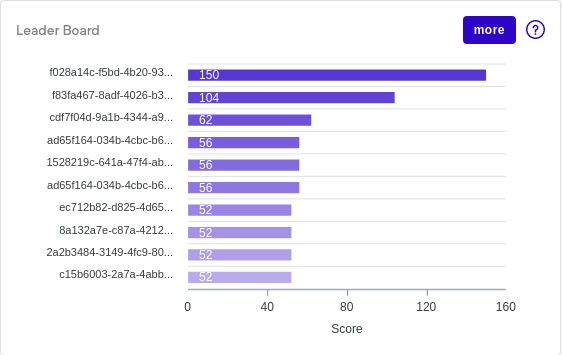
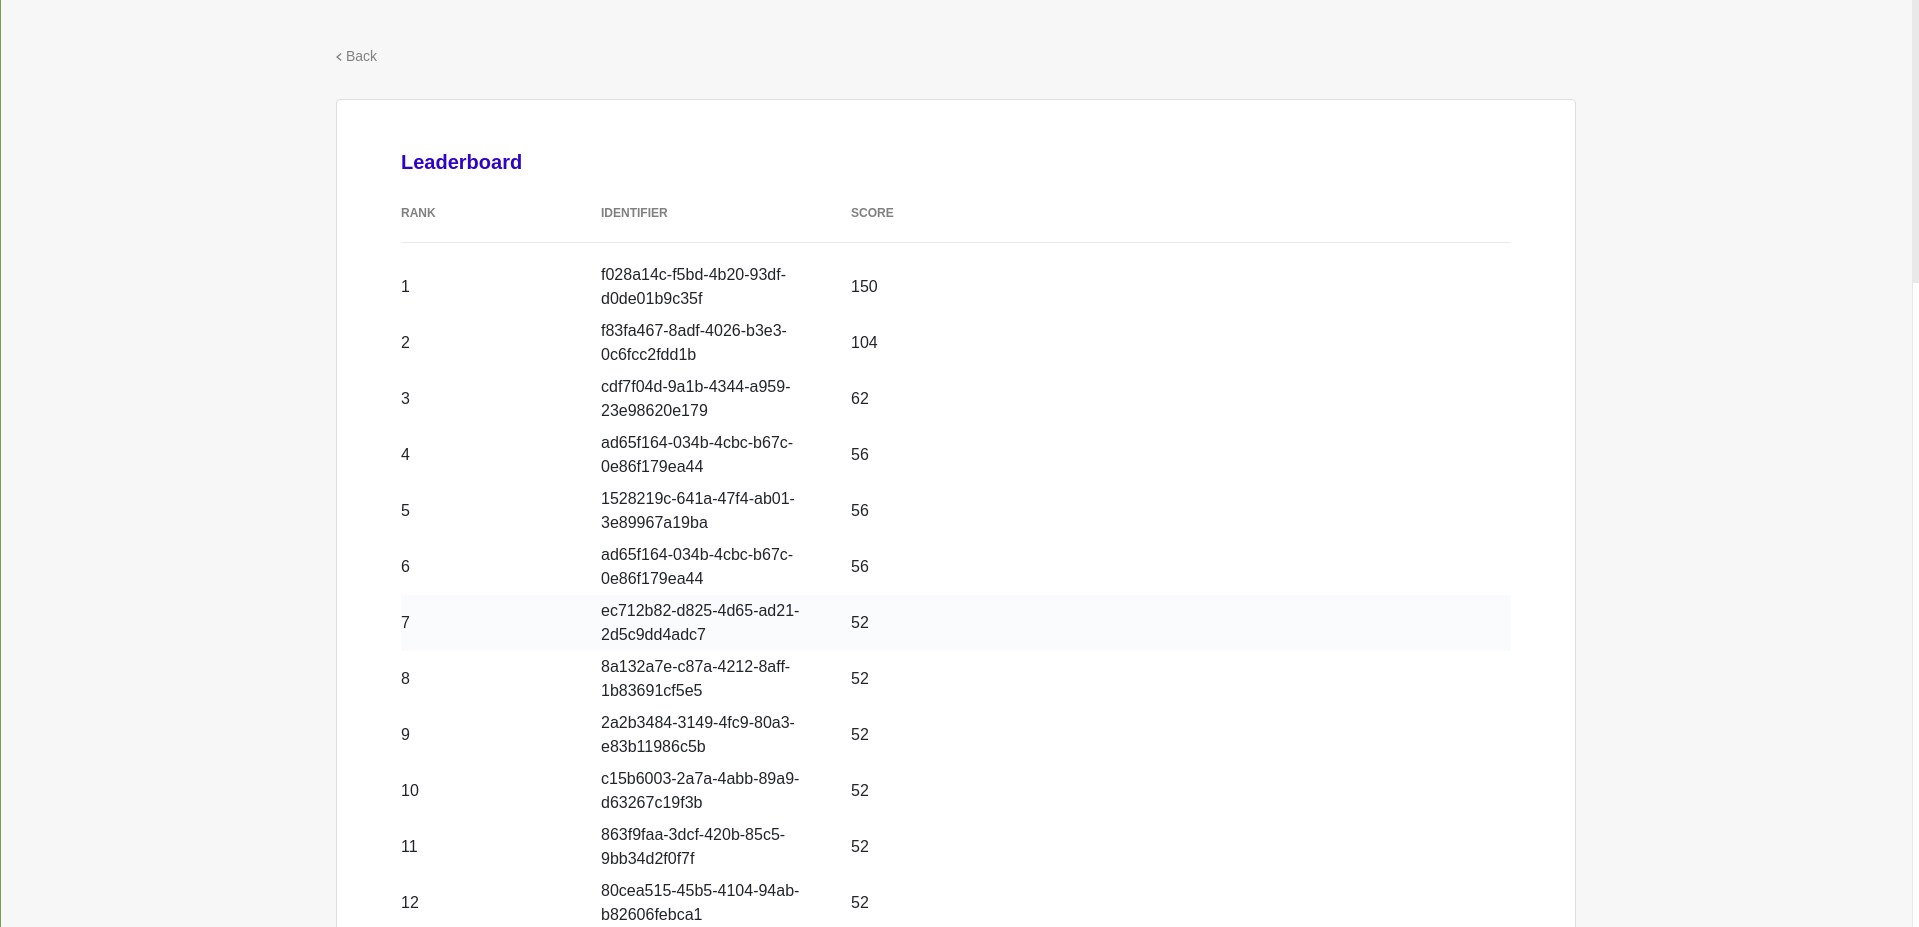
Leader Board
Leader board analytics page
- The Leader board on the analytics page shows a peek at the leaderboard page through a mini chart.
This section will show up the score counted by the Score element in your experience.
Leader board on a separate page
When you click on the more button, you'll be taken to a leader board page. This page provides you with further customizations on what information you want to show on the leader board via URL parameters.
Fixed Parameter
- Notice that the leaderboard's page URL already has a
page_tokenparameter. This is used for authentication and should not be removed.
Optional Parameters
The following parameters can be optionally passed in the leader board URL:
Parameter Default Values Function Table Header rows=<num>50Controls the number of rows shown in the leaderboard. - show_rank=true|falsetrueControls if the viewer rank is shown in leader board. Rank show_identifier=true|falsefalseControls if the viewer identifier is shown in the leaderboard. Identifier show_name=true|falsetrueControls if the viewer name is shown in the leaderboard. Name show_variables=<header1|var_name_1>, <header2|var_name_2>....- Exposes any custom user variables. Here, headeris any placeholder for the variable. The variable name to be shown is provided after the pipe|.As provided within the parameter ( header1,header2etc.)show_score=true|falsetrueControls if the viewer score is shown in leader board. Score keep= variable1_name| include_value_1: include_value_2: include_value_3, variable2_name| include_value_1: include_value_2: include_value_3- Use a variable to filter the leaderboard. A variable associated with the viewer is used as a table filter. `keep`will keep entries in leaderboard for only the specified variable values. One can allow inclusion of multiple variable values as well as filter using multiple variable. Variable values are separated by a colon ':', variables are separated by a ',' and variable are separated from their values by '|'. -
caution
This page is accessible to anyone who has the link to the page.
Filter
You can choose to filter analytics by time. Find the dropdown menu for this on analytics page.
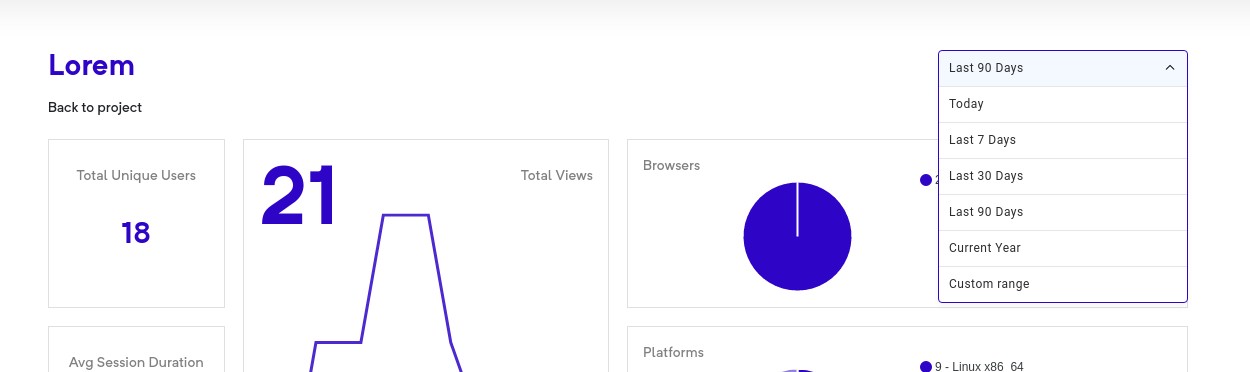
Filter Options
You can choose to filter with the following duration filters:
- Today
- Last 7 days
- Last 30 days
- Last 60 days
- Last 90 days
- Custom Range